


Analysis of Cboe Global Markets, Inc
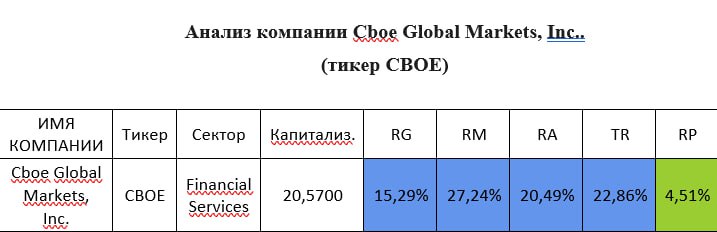
(CBOE ticker)
According to all the ratings we calculate - except for the price rating - the company ranks among the top 25% of U.S. companies. Based on the price rating, it ranks in the top half of U.S. companies.
Sales
- 2018 - $2,769 million
- 2023 - $3,774 million
Over the past 5 years, CBOE’s sales have grown by an average of 6.39% per year:
The average annual sales growth for all U.S. companies during this period was 9.6% per year.
Operating profit
- 2018 - $599 million
- 2023 - $1,058 million
Over the past 5 years, CBOE’s operating profit has grown by an average of 12.05% per year
The average annual growth in operating profit for U.S. companies during this period was 17.45% per year
Earnings per share
- 2018 - $3.81 per share
- 2023 - $7.16 per share
The company’s earnings per share have grown by an average of 13.45% per year over the past 5 years. The average annual growth in earnings per share for U.S. companies during this period was 7.8% per year.
Net profit margin
- 2018 - 15.40%
- 2023 - 20.18%
The company’s net profit margin has grown by an average of 5.56% per year over the past 5 years. The average annual growth in earnings per share for U.S. companies during this period was 3.8% per year.
For its shareholders, the company generates 20.18 cents of net profit from every dollar of sales. On average, U.S. companies generate 3.3 cents of profit for their shareholders for every dollar of sales.
Discussion on Telegram
No comments yet. Be the first!
Sign in with Telegram. Your comment will appear under the post in the channel.