


Many analysts say that the legendary Warren Buffett is actively selling shares of Apple and Bank of America
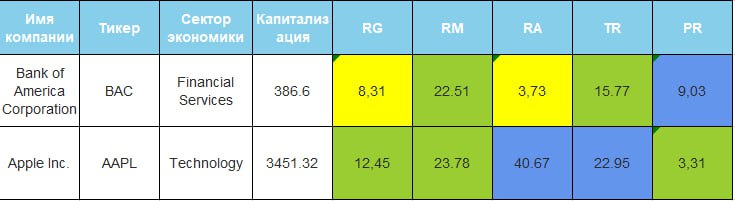
We’ve analyzed these stocks for you:
Analysis of APPLE
(Ticker: AAPL)
Revenue
- 2018 - $265,595 million
- 2023 - $383,285 million
Annual growth of 7.63% over the past 5 years
The average annual sales growth for U.S. companies over this period was 9.6% per year.
Operating income
- 2018 - $70,898 million
- 2023 - $114,301 million
Operating income has been growing by 10.02% per year over the past 5 years. The average annual growth in operating income for U.S. companies during this period was 11.36 per year.
Earnings per share
- 2018 - $3 per share
- 2023 - $6.16 per share
Growth of 15.48% per year over the past 5 years. The average annual growth in earnings per share for U.S. companies over this period was 7.83 per year.
Net profit margin
- 2018 - 22.41%
- 2023 - 25.30%
The net profit margin is good, and it has been growing by 2.46% per year over the past 5 years. On average, U.S. companies generate 3.3 cents in earnings per dollar of revenue for their shareholders.
P/E
- 21.09
A good figure. Currently, the average P/E ratio for the S&P 500 is 25.
Analysis of Bank of America Corporation
(Ticker: BAC)
Revenue
- 2018 - $87,738 million
- 2023 - $95,787 million
Annual growth of 1.77% over 5 years
The average annual sales growth for U.S. companies over this period was 9.6% per year.
Operating income
- 2018 - $41,550 million
- 2023 - $39,500 million
Operating income is declining
The average annual growth in operating income for U.S. companies over this period was 11.36 per year.
Earnings per share
- 2018 - $2.64 per share
- 2023 - $3.10 per share
Growth of 3.26% per year over the past 5 years. The average annual earnings per share growth for U.S. companies during this period was 7.83 per year.
Net profit margin
- 2018 - 32.08%
- 2023 - 27.68
The net profit margin is good, but it is declining. On average, U.S. companies generate 3.3 cents in earnings for their shareholders for every dollar of revenue.
P/E
- 10.68
This is a very good figure. Currently, the average P/E ratio for the S&P 500 is 25. However, for banks, this ratio is always below the market average.
Discussion on Telegram
No comments yet. Be the first!
Sign in with Telegram. Your comment will appear under the post in the channel.